Search News
Industry Portal
Hot Articles
- DEPA Commercial Secures Permit for Greece’s First Compressed Biomethane FacilityDEPA Commercial secures a permit for Greece’s first compressed biomethane facility. Explore how the project aims to turn surplus biogas into renewable gas with over 97% methane purity.
- Sizing chemical dosing systems for RO pretreatment at variable flowSize chemical dosing systems for RO pretreatment to handle variable flow with confidence. Learn how to match pump turndown, dose accuracy, and controls to protect membranes and reduce chemical waste.
- Industrial Wastewater Treatment Market Forecast to Reach $271.6 Billion by 2036Industrial wastewater treatment market forecast: $271.6 billion by 2036. Explore how AI, ZLD, water reuse and PFAS rules could shape investment opportunities.
Popular Tags
Industry NewsHow Can Water Metering Identify Abnormal Consumption?
auth.
Marcus ValveTime
Oct 15, 2026Click Count
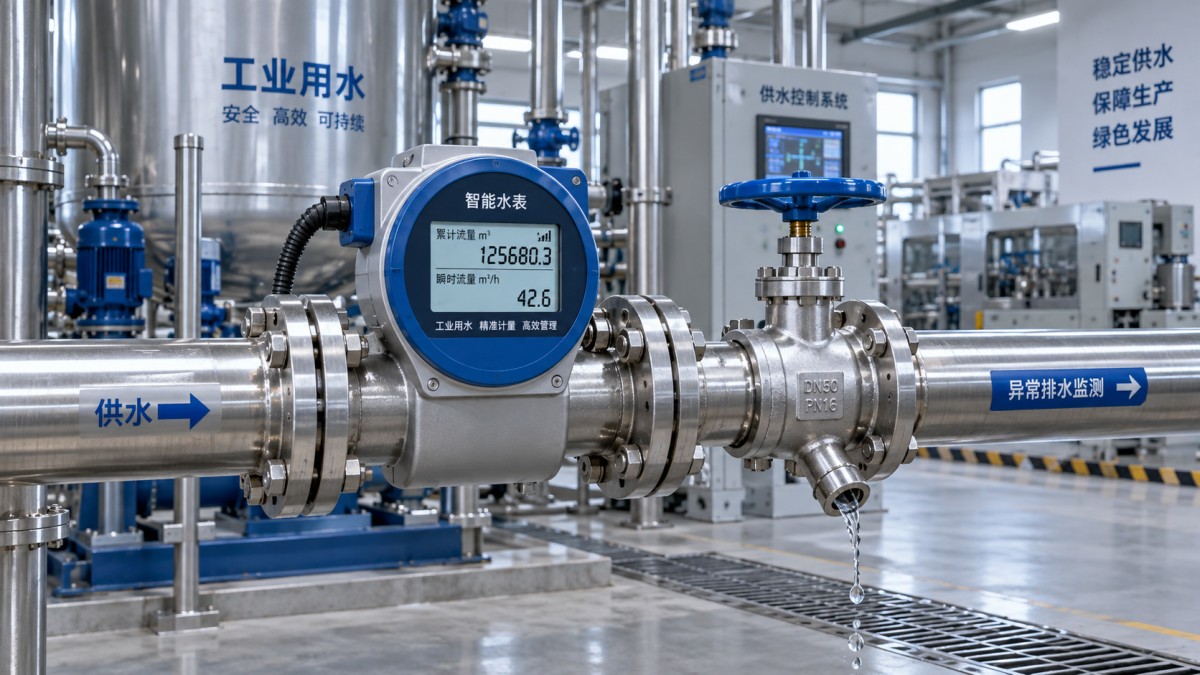
Water metering identifies abnormal consumption by showing when water use departs from an expected pattern. Continuous flow during a shutdown, a sudden increase without a corresponding activity change, or a gradual rise in water used per production cycle can all signal a problem. The meter provides evidence of unusual demand; operating records and physical checks establish whether the cause is a leak, faulty equipment, unnecessary use, or a legitimate change.
The useful question is therefore more specific than “Is consumption high?” It is: “Is this amount of water reasonable for what was happening at that time?” Answering it requires readings detailed enough to reveal patterns, a realistic baseline, and a clear response when an alert appears.
Why a total reading rarely explains the problem
A monthly meter reading can reveal that consumption increased, but it cannot show whether the increase came from a short incident or a small flow continuing every day. Those two situations need different investigations. A burst pipe may create an obvious spike, while a passing valve can add substantial consumption without producing a dramatic peak.
Interval data divides consumption into shorter periods. Depending on the monitoring system, readings may be recorded every few minutes, hourly, or at another configured interval. This makes it possible to connect water use with shifts, cleaning cycles, irrigation schedules, tank filling, and equipment operation.
The recording interval should match the event being investigated. Hourly data may expose persistent overnight demand, but it can obscure a brief discharge. More frequent readings provide greater detail, although communications, battery life, storage, and cost can constrain practical choices. Also distinguish recording frequency from transmission frequency: a meter may capture detailed readings but upload them too late for an urgent response.
The consumption patterns that deserve attention
Different abnormalities leave different signatures. Looking at the shape and timing of consumption often gives a more useful starting point than looking at the daily total alone.
None of these patterns proves a particular fault. Overnight flow, for example, is suspicious only if the monitored area should be inactive. Cooling systems, sanitation processes, and storage replenishment may legitimately continue after normal operating hours.
Similarly, low or missing consumption can be abnormal. It may indicate an interrupted supply, a closed valve, a failed meter, or missing communications. Monitoring should identify departures in both directions, especially where water availability affects operations.

Build a baseline that reflects actual activity
A useful baseline describes expected consumption under comparable conditions. Comparing every day with one overall average can create repeated false alarms: a busy production day, a shutdown day, and a cleaning day do not have the same water requirements.
Start with historical readings from periods when operations were understood and reasonably stable. Group comparable periods by working schedule, process activity, occupancy, or other relevant conditions. Where outdoor use or cooling demand is significant, seasonal and weather effects may also need consideration.
Historical use is not automatically healthy use. A long-standing leak can become part of the apparent normal pattern. Review quiet-period flow and known equipment loads before accepting the baseline. Otherwise, the system may detect new losses while overlooking an existing one.
For variable production, water use per unit of output can be more informative than total consumption. The comparison still needs context: different products may require different rinsing or cleaning cycles. A change in product mix can raise water intensity without indicating equipment failure.
Keep the baseline responsive to genuine operating changes without allowing it to absorb every unexplained increase. When consumption rises and stays high, investigate before resetting the expected range. Otherwise, an adaptive monitoring system may gradually treat a persistent fault as normal.
Set alerts around duration and operating conditions
A single high-use threshold is easy to configure but often difficult to trust. It may trigger during an ordinary cleaning cycle and miss a small continuous leak. Better alerts combine the size of a deviation with its duration and the operating state.
For example, a shutdown alert can flag flow that remains above the expected background level across several consecutive readings. A peak-demand alert can identify flow outside a reasonable operating range. A daily-volume alert can catch accumulated excess use, while a trend alert can identify a slow increase across comparable days.
The persistence requirement helps prevent an isolated reading from creating unnecessary work. However, making it too long can delay detection of a significant event. Alert settings should reflect the likely consequences and the time available to respond.
Separate urgent events from routine investigations. A sharp, sustained rise may need immediate inspection, while a modest increase in water intensity may belong in an operational review. Each alert should include the meter location, event start time, measured consumption, expected range, and relevant operating status.
Basic rules are often sufficient where schedules are predictable. Statistical models can help when several interacting factors affect demand, but they still depend on reliable data and meaningful operating inputs. A more complex model will not compensate for incorrect timestamps or an unclear meter boundary.
Use meter placement to narrow down the source
A main incoming meter shows that total demand has changed. It usually cannot identify which building, process, or branch caused the change. Submetering creates smaller measurement boundaries, allowing abnormal consumption to be traced through the distribution system.
Place submeters where the result can guide an action: around a process with substantial demand, a separate building, an irrigation supply, or equipment suspected of continuous use. Installing meters everywhere can create unnecessary expense and more data than anyone can use. Start with boundaries that separate plausible causes.
A water balance can reveal unexplained differences between incoming volume and measured downstream use. However, the comparison must account for all relevant flows and storage changes. If a tank fills during the measurement period, incoming water can exceed downstream consumption even when no leak exists.
Readings also need aligned time periods and compatible units. A balance using mismatched timestamps can suggest losses that are simply timing differences. Meter uncertainty and unmetered legitimate uses must be considered before treating a residual as leakage.
In systems using reclaimed water, distinguish fresh-water intake from internal circulation. A recirculation meter can record the same water passing repeatedly through a loop. Adding that volume to fresh-water consumption produces a misleading picture of resource use.
Choose meters for the flow conditions you need to detect
Meter selection affects which abnormalities are visible. A meter suitable for normal operating demand may be less effective at registering the small flow associated with a persistent leak. Check its usable measurement range against both expected peak demand and the lowest flow that matters to the investigation.
Oversizing can weaken low-flow detection, depending on the meter design. Selection should therefore consider actual demand rather than pipe diameter alone. Installation conditions also matter: pipe fullness, disturbed flow, trapped air, and unsuitable positioning can affect readings.
Different technologies suit different applications. Mechanical meters can provide practical consumption measurement, although wear or debris may affect performance. Ultrasonic meters avoid moving measuring components, but their suitability depends on the design, fluid, and installation. Electromagnetic meters can suit conductive liquids, subject to their operating and installation requirements.
Temporary clamp-on monitoring can help investigate a branch before committing to permanent submetering. Its usefulness depends on pipe information, access, sensor positioning, and achievable measurement quality. It should be assessed against the size of the abnormal flow being investigated.
When comparing equipment, ask how it performs across the relevant flow range, how readings are logged, and what happens when communications fail. Local data storage can preserve the consumption history during an outage, even though remote alerts may arrive later.
Turn an alert into a verified finding
Once an anomaly appears, use a consistent investigation sequence. This keeps the response focused and helps separate actual consumption changes from data problems.
- Check the reading. Review timestamps, units, missing intervals, duplicate records, and meter status. Confirm whether the display shows cumulative volume or interval consumption.
- Check what was operating. Compare the event with production, cleaning, maintenance, irrigation, and tank-filling records.
- Find the affected boundary. Use downstream meters or temporary measurements to narrow the increase to a branch or process.
- Inspect the likely causes. Look for passing valves, overflowing tanks, unusual discharge, damaged pipework, and equipment running beyond its intended cycle.
- Confirm the effect of corrective work. Compare consumption under similar operating conditions after the repair or adjustment.
Where operationally safe, controlled isolation can help locate continuous demand. Closing an appropriate branch and observing the resulting flow change may identify the affected area. This needs coordination where isolation could interrupt essential processes or protective systems.
Record the confirmed cause and outcome. If alerts repeatedly correspond to legitimate activity, refine the schedule or expected range. If a repair produces no measurable change, reconsider the diagnosis or measurement boundary before closing the investigation.
Start with one useful detection task
A practical starting point is to select one measurable concern, such as unexplained flow during shutdowns or rising water demand in a particular process. Confirm the meter can capture that pattern, establish expected consumption, and assign responsibility for reviewing alerts. This provides a clear basis for judging whether additional monitoring is worthwhile.
Measure success through confirmed findings and sustained improvements, rather than the number of alerts generated. An alert becomes valuable when it leads to a located cause, an appropriate action, and evidence that consumption returned to a reasonable level. Reliable readings, sensible comparison periods, and follow-through are what turn water metering into effective abnormal-consumption detection.
Recommended News
TIME
{item.publish_time}{item.title}{item.description}auth.
{item.goods_category_sif3qfva9d}Read MoreCONTACT US